OrientationObservationIn-depth interviewsDocument analysis and semiologyConversation and discourse analysisSecondary Data
SurveysExperimentsEthicsResearch outcomes
Conclusion
8.4.3.6.2 Non-parametric tests of significance This section considers some of the non-parametric tests of hypotheses. Unlike the parametric tests investigated in Section 8.4.3.6.1, these tests are not concerned with testing a single statistic of the population whether it be a proportion, mean or variance. Non-parametric tests test the entire distribution of a sample or samples against what would be expected if the samples came from a distribution of a stated type, or, alternatively, test two or more sample distributions to see if they are significantly different.
For example, the parametric t-Test can be carried out on two small samples to see whether the sample means are significantly different. A corresponding non-parametric test would be the Mann-Whitney U test. This tests the population distributions from which the two samples are drawn to see if they are identical. The non-parametric test does it on the basis of comparing the distributions (rather than the means) of the two samples for significant difference.
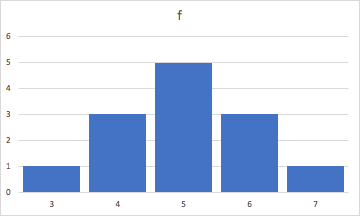
Consider the two distributions below:
Distrlbution 1. X = 1, 1, 2, 2, 3, 3, 4, 4, 5, 5, 6, 6, 7, 7, 8, 8, 9, 9.
Distribution 2. X = 3, 4, 4, 4, 5, 5, 5, 5, 5, 6, 6, 6, 7.
Both these distributions have identical means (and medians) i.e. Mean = 5, median = 5.
However, as can be seen from the diagrams of the two distributions they are quite distinct. Distribution 1 is clearly rectangular while distribution 2 approximates a normal distribution.
A parametric test of means would show no significant difference if these two distributions represented samples assumed to be from the same population. This may well not be the case with a non-parametric test where the sample distributions would be significantly different (at the same level of confidence. (However, a parametric test of the variance of the two samples, using the parametric F-Test, would show the two samples are significantly different. Such a result would then be more in accordance with the result of a non-parametric test).
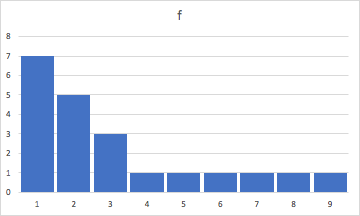
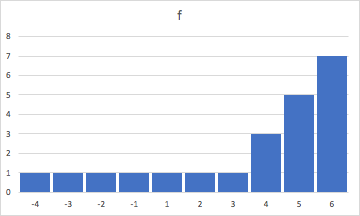
Consider a further example in which all parametric tests differ in their conclusions from non-parametric tests.
Distribution A. X = 1, 1, 1, 1, 1, 1, 1, 2, 2, 2, 2, 2,3, 3, 3, 4, 5, 6, 7, 8, 9, 10
Distribution B. X = -4, -3,-2,-1, 1, 2, 3, 4, 4, 4,5, 5, 5, 5, 5, 6, 6, 6, 6, 6, 6, 6
Both these distributions have a mean of 3.409 and have an identical spread with a variance of 10. But the diagrams below show that the two distributions are quite distinct, each being an overlapping mirror image of the other.
Consequently, parametric tests would suggest no significant difference between the two samples A and B. However, a non-parametric test may result in a conclusion of significant difference, because non-parametric tests consider the entire lay out of the distribution, not just the sample parameters.
Does this mean that one type of test is correct and the other wrong? The answer to such a question cannot be generalised, it depends upon the particular situation. One has to decide what is being tested, whether the concern is solely with a particular parameter or a broader comparison.
The decision to use a parametric test or non-parametric test depends upon what is being tested and, rather more importantly, the scale of the available data. A parametric test requires at least interval scale data. Some non-parametric tests may be applied to nominal or ordinal scale data. Parametric tests, when available, are regarded as statistically more powerful than non-parametric tests (which basically means the results are more precise with less data), but are often surrounded by stringent conditions.
There aremany non-parametric tests, dealing with different situations. Some of them are explained in sections 8.4.3.6.2.1 to 8.4.3.6.2.8.